


What is Box and Whisker Plot?
The Box and Whisker Plot (or Box Plot) is a wonderful method of visually displaying the
distribution of data through their quartiles, minimum and maximum value. This graph presents information from a five-number summary. The five-number summary is the minimum, first quartile, median, third quartile, and maximum.

In a box plot, we draw this from the first quartile to the third quartile. A vertical line goes through the box at the median. The whiskers go from each quartile to the minimum or maximum.
Create Box and Whisker Plot in Excel
After the R, Excel is a wonderful tool for the statistics. Box and Whisker Plot Excel will ease your effort for presenting your data in much more nicer way.
-
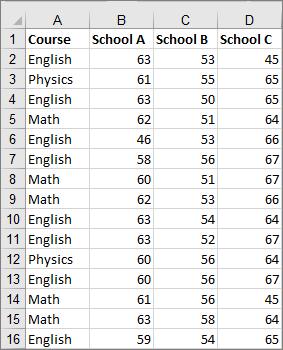
Select your data—either a single data series, or multiple data series.
(The data shown in the following illustration is a portion of the data used to create the sample chart shown above.)
- In Excel, click Insert > Insert Statistic Chart >Box and Whisker as shown in the following illustration.
Important: In Word, Outlook, and PowerPoint, this step works a little differently:
- On the Insert tab, in the Illustrations group, click Chart.
- In the Insert Chart dialog box, on the All Charts tab, click Box & Whisker.


Tips:
- Use the Design and Format tabs to customize the look of your chart.

- If you don’t see these tabs, click anywhere in the box and whisker chart to add the Chart Tools to the ribbon.

Change box and whisker chart options
- Right-click one of the boxes on the chart to select that box and then, on the shortcut menu, click Format Data Series.
- In the Format Data Series pane, with Series Options selected, make the changes that you want.(The information in the chart following the illustration can help you make your choices.)
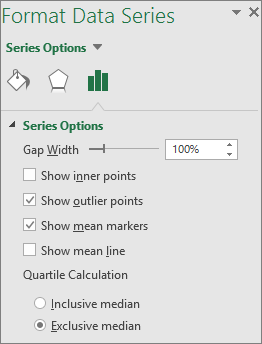
Series option Description Gap width Controls the gap between the categories. Show inner points Displays the data points that lie between the lower whisker line and the upper whisker line. Show outlier points Displays the outlier points that lie either below the lower whisker line or above the upper whisker line. Show mean markers Displays the mean marker of the selected series. Show mean line Displays the line connecting the means of the boxes in the selected series. Quartile Calculation Choose a method for median calculation: - Inclusive median The median is included in the calculation if N (the number of values in the data) is odd.
- Exclusive median The median is excluded from the calculation if N (the number of values in the data) is odd.

How to Interpret Box and Whiskers Plot
Now, for the Interpretation of the Box and Whiskers plot, you need t get familiar with the few important things.
Median
The median (middle quartile) is the mid-point of the data and is visualized by the line that splits our box into two parts. Half the scores are greater than or equal to this value and half are less.
Inter-quartile range
The middle “box” represents the middle 50% of scores for the group. The range of scores from lower to upper quartile is referred to as the inter-quartile range. The middle 50% of scores fall within the inter-quartile range.
Upper quartile
Seventy-five percent of the scores fall below the upper quartile.
Lower quartile
Twenty-five percent of scores fall below the lower quartile.
Whiskers
The upper and lower whiskers represent scores outside the middle 50%. Whiskers often (but not always) stretch over a wider range of scores than the middle quartile groups.
Online Box and Whisker Plot Generators
You can do this using Box and Whisker Plot Makers. This is not a recommended practice but if you are in hungry and need to present your data in some presentation or talk, you can use these free online Box and Whisker Plot Makers.
Not all these box and whisker plot generators works same, so you may better go for the above box and whisker plot excel. But still, if you wish to use them. Here are these.
- Meta Chart’s Box and Whisker Plot: Clean in User-interface, this tool allows you to make plots through only four steps. In first step, you design the colors of your plot. In second step, you give your data to the tool. In third step, you assign labels. In fourth steps, you get your plot. Click Here
- Barcelona Field Study Center’s Tool: This box and whisker plot generator tool does everything in a single step, you add all your data and labels in the form. Just like, previous tool, this tool doesn’t allow you load the data directly from the box and whisker excel. You need to type it there. Click Here
If you feel any ambiguity in creating Box and Whisker Plot in Excel, Interpretation of the plot or the Generating these online, Feel free to comment below. If you any suggestion for the improvement of this topic and wish us to write any other similar topic, feel free to comment.
Your feedback is very important to us.